Momentum Investing
Momentum Investing buys stocks with recent price gains to ride their upward trend and avoids those with declining prices.
June 21, 2024
One day, I met a medical shop owner who was investing in the stock market. Curious about his approach, I asked him, "How do you invest?"
He replied, "I look for stocks that have given good returns over the past year. I select those which have performed well and invest in them." His simple yet effective strategy intrigued me. Essentially, he was buying high and aiming to sell even higher, embodying the core principle of momentum investing.
This anecdote highlights the intuitive appeal of momentum investing—identifying stocks with strong past performance and banking on the continuation of their trends.
Identifying Momentum: Tools and Indicators
There are several tools and indicators that traders/investors use to identify momentum, such as moving averages, RSI, MACD, ROC (rate of change), and Bollinger Bands, among others.
Building a Momentum Portfolio: The Medical Shop Owner's Approach
Let's build a portfolio using the medical shop owner's style of investing and see how it works. Below are the conditions and assumptions for this momentum-based portfolio approach:
- Stock Universe: NSE 200 (consists of large caps and mid caps stocks with fairly good quality of price data)
- Test Duration: 2011 - 2021
- Type of Data: Close price adjusted for dividend, split, bonus, etc.
- Portfolio Size: 10 stocks
- Risk: 1/10, i.e., each stock carries a maximum risk of 10% on the capital invested.
- Initial Capital: ₹10,00,000
- Allocation: Equal (10% of the capital would be invested in each stock)
- Rebalance Period: 6 months
Strategy: Returns-Based Momentum Model
- Formula: Returns = (Price today - Price nth day) / Price nth day * 100
- Approach: Take the average of 60 and 120 days returns to identify momentum in each stock
Below is a chart showing the price of RIL along with its average return computed using this method.
As you see, when the prices are rising, the return graph remains positive, and when the prices of RIL are falling, returns are negative.
Executing the Strategy
Every rebalance period (every 6 months):
- Take the list of Nifty 200 stocks.
- Calculate their average returns: (60 days + 120 days) / 2; & > 0.
- Rank the stocks based on their returns (higher return, higher ranking).
- Invest in the top 10 stocks.
- Wait for 6 months to repeat the process.
Performance Summary
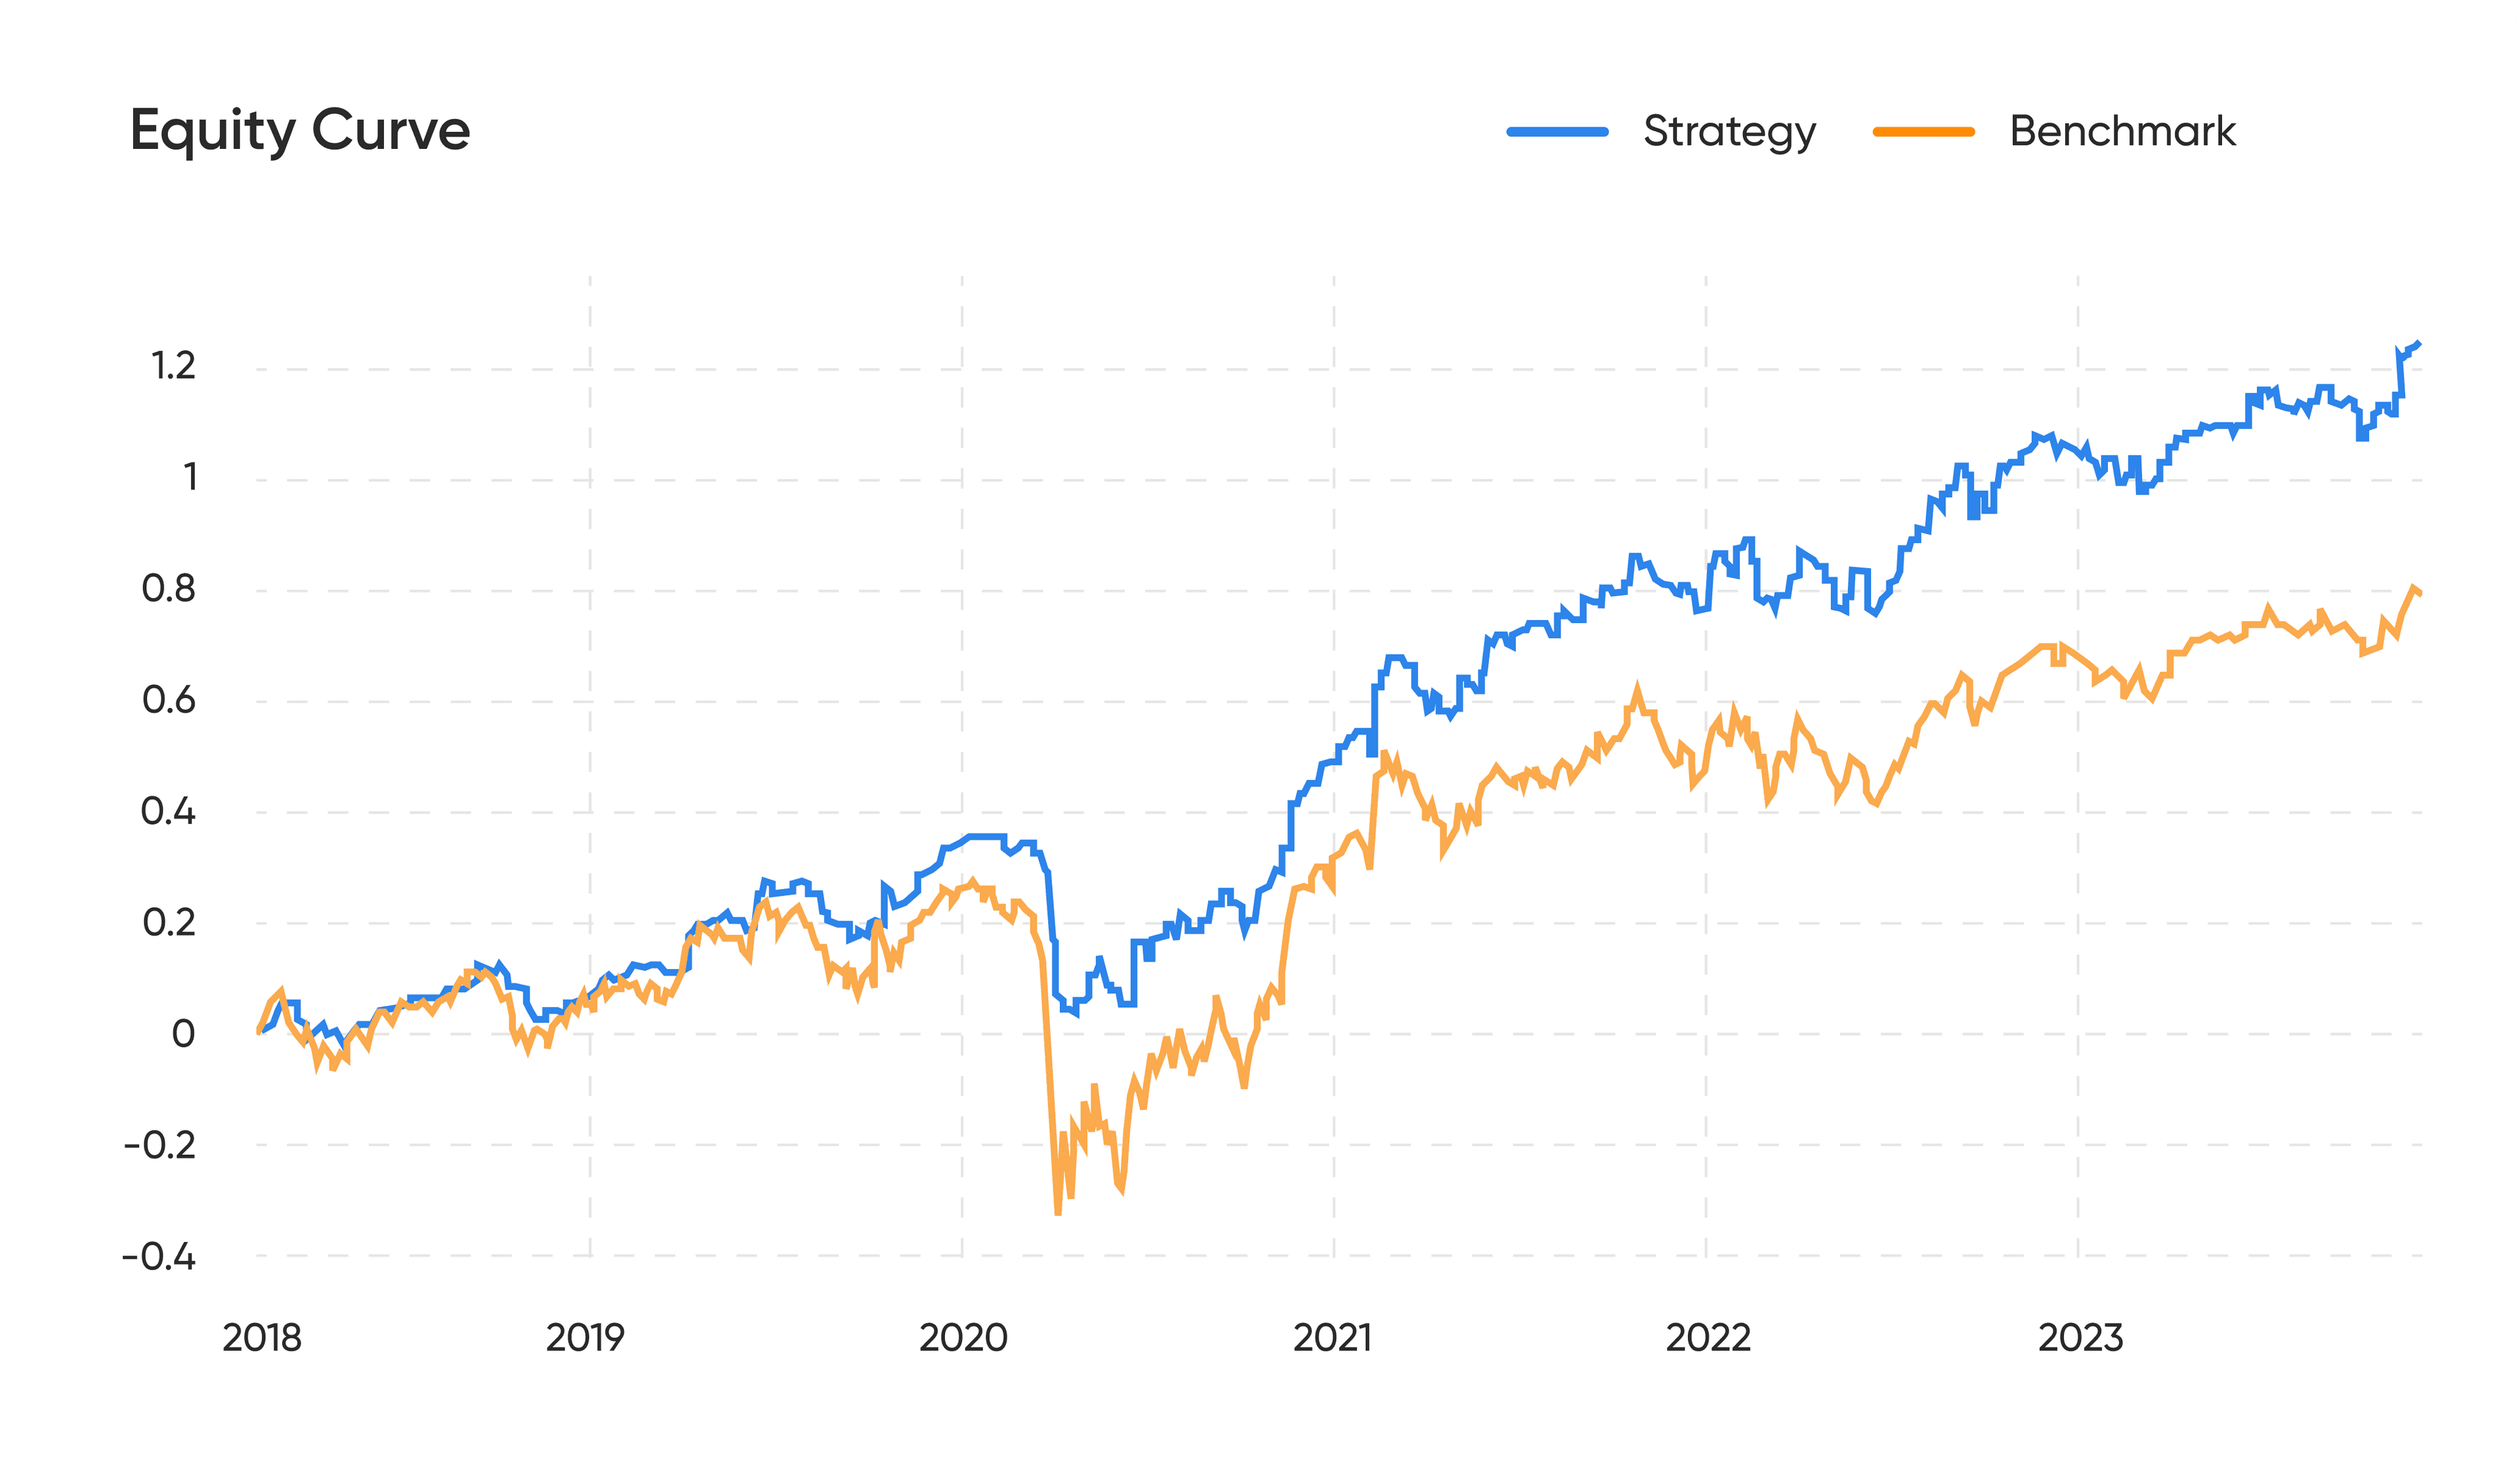
The model generated an annual CAGR of 23.3% over 9 years with a 42% drawdown during the COVID market crash, beating the Nifty 50 Index by a good margin.
Addressing Volatility: Improving the Model
Let's plot IDEA and RIL's price, returns, and volatility:
On July 31, 2020, IDEA had a 164% return against 105% volatility, while RIL had an 82% return against 40% volatility (almost 70% lower compared to IDEA). Volatility indicates the fluctuations in prices; IDEA would vary by 100% annually.
The model would rank IDEA above RIL considering the returns, ignoring the volatility. To account for volatility, we introduce the Momentum Ratio:
- Momentum Ratio: Return / Risk (Volatility)
- Risk: Std Dev of log-normal daily returns for 6 months * Sqr Root(120 days)
Calculating Momentum Ratio
For RIL and IDEA:
- RIL = 82.5 / 41.3 = 2.0
- IDEA = 164.4 / 105.2 = 1.5
Performance with Momentum Ratio
This adjustment doesn't change the returns but reduces the risk—drawdown and daily value at risk reduced to 36.6% and 2.2% against 42.5% and 2.5% previously.
A Different Perspective: Sustainable Growth
Let's re-look at IDEA and RIL during 2020.
If you look at both the price Charts, Idea has moved in the initial period and its return has been flat post Jun 2020, while RIL has been growing consistently.
The perspective we are trying to get here is to identify the stocks which move consistently over the period like RIL. The thought process behind this is to capture the growing stocks and not the one which has already grown but the one which is growing consistently.
R Square is an amazing tool which could tell us the consistency in the data points. Lower R sqr would mean data are far scattered from the line of best fit (Regression Line) and a R Sqr closure to 1 would mean the data are consistent and close to each other.
Strategy: Momentum Score
Our strategy here is to compute a Ranking mechanism where the prices are growing but with consistency. Let’s name it as Momentum Score
Momentum Score = Annualise Slope * R Sqr
Slope - Rate of Change of Reg. Line
R Sqr - Explains how well the stock Prices fit with the Reg. Line
Momentum Score:
RIL = 165 *0.77 = 127
Idea = 274 * 0.46 = 126
Now Rank the Stocks based on Momentum Score and Invest in the top 10.
Here is a python snippet of the formula if you are looking to code one
Below is the performance summary:
Good improvement in the model giving a CAGR of 27.7% with 34.4% drawdown and 2.5% daily VAR.
Below are the detailed metrics if you wish to know more data over the period.
Conclusion
Momentum investing offers a compelling strategy for those looking to capitalize on market trends. By using the right tools and understanding the principles, investors can potentially enhance their portfolio returns. As always, careful analysis and risk management are crucial to success.
At Inuvest, we conduct quantitative research and build investment theses. Do write to us to know more about our quantitative strategies at quants@inuvest.tech.
Enhance Your Financial Strategy – Reach Out for Personalised Advice!
Are you a HNI, SME/Startup or a Proprietary Trading Firm Looking to Manage your Wealth?
Schedule a demo to explore how our solutions can help you manage and grow your wealth effectively.
Recent blogs

Momentum Investing
Momentum Investing buys stocks with recent price gains to ride their upward trend and avoids those with declining prices.
June 21, 2024

Generating Alpha on broad market Index
Is it feasible to beat the market? The article tests hedging concepts to manage the downside and generate alpha on Index.
February 9, 2024

Selling Options No Longer Rewarding in the Indian Markets?
India Vix of the IV of Nifty is at an all-time low.
September 11, 2023

Algo Trading: Ultimate Beginners Guide 2023
Executing strategic algorithms to automate trading decisions and optimize financial portfolios in real-time.
February 1, 2024

Covered Calls to Reduce Stock Purchase Cost
Options can be effectively used to reduce the effective cost of purchasing stock.
September 1, 2023

Options Hedging: Safeguarding Your Investments
Hedging is an investment technique used to reduce the risk of adverse price movements in an asset.
September 1, 2023

Risk Management in Options Trading
Options trading, carries with it a unique set of risks. Managing these risks is crucial for the long-term success of any trader.
August 1, 2023